Investing
How to value a stock using the Dividend Discount Model (DDM)?

This page may contain some affiliate links. This means that, at no additional cost to you, Alpha Investing Group will earn a commission if you click through and make a purchase. Learn more.
At the time of writing, the price of AT&T (T) is $29.13. Is the stock undervalued, overvalued, or fairly valued? This is probably the most common stock valuation question, and there are many different ways that you can use to arrive at the answer.
Today, let's discuss how we can answer this question using one of the oldest, simplest stock valuation approaches — the Dividend Discount Model (DDM). It is the most fundamental stock valuation approach that any investor should understand, both its concept and application in valuing stocks.
In the following article, besides explaining the concept of DDM, I will also demonstrate how to use the Dividend Discount Model formula to value a stock so that you will be able to do it yourself after spending 5 minutes reading this article. In the end, the strengths and limitations of the DDM model are also elaborated.
In 5 minutes, this article will allow you to:
- Understand the fundamental concept of DDM
- Get to know different variations of the DDM model
- Formulate your own investment decision by performing stock valuation using DDM
- Evaluate if a stock is overvalued, fairly valued, or undervalued by the market
- Understand the limitations of DDM and ways to get around them
Note: The understanding of the Present Value concept is essential in this reading. To know more about what is a present value model, please read this.
What is DDM?
The dividend discount model (DDM) is a prevent value model. It estimates the present-day price of a stock by adding up all of the present values of its future cash flows. The stock is deemed undervalued if the value obtained from the DDM is higher than the current trading price of shares and vice versa.
So, what are the future cash flows for a company's stock? It is actually very straightforward. Let's say you are a shareholder who buys and holds a share of stock. The cash flows you will obtain are the dividends paid on it and the market price of the share when you decide to sell it. Hence, the present-day price of a stock should equal the sum of the present value of its expected dividends plus the present value of the expected selling price.
Variations of DDM
There are two main variations of DDM, namely the constant growth DDM and multistage DDM. In this article, we will cover the most famous constant growth model — the Gordon Growth Model.
As the multistage DDMs are more advanced, they are not covered in this article. If you are interested to know more, please leave a comment at the end of the article.
Let’s start with the fundamentals before diving into more advanced topics.
Single-Period and Multiple-Period DDM
Now, imagine you buy a share of stock and want to hold it for a year. According to the theory mentioned above, the fair value of that share of stock today should be the present value of the expected dividend received on the stock plus the present value of the expected selling price in one year. This concept is depicted in the DDM formula shown below.
$$V_0 = \frac{D_1}{(1+r)^1} + \frac{P_1}{(1+r)^1} = \frac{D_1 + P_1}{(1+r)^1}, where$$
\(V_0 =\) fair value of stock today (Year 0)
\(P_1 =\) expected price per share in Year 1
\(D_1 =\) expected dividend per share for Year 1
\(r =\) required rate of return on the stock \(=\) cost of equity
So, what happens if you decide that you want to hold it for two years instead?
The fair value of the stock should be the present value of the expected dividend in Year 1, plus the present value of the expected dividend in Year 2, plus the present value of the expected selling price at the end of Year 2, as shown in the DDM formula shown below.
$$V_0 = \frac{D_1}{(1+r)^1} + \frac{D_2}{(1+r)^2} + \frac{P_2}{(1+r)^2} = \frac{D_1}{(1+r)^1} + \frac{D_2 + P_2}{(1+r)^2}$$
Building on this theory, if you want to hold it for n-period of time, the value of a stock should be the present value of the expected dividends for the n periods plus the present value of the expected price in n periods (at t = n), just like the expression below.
$$V_0 = \frac{D_1}{(1+r)^1} + \cdots + \frac{D_n}{(1+r)^n} + \frac{P_n}{(1+r)^n} = \sum_{t=0}^n \frac{D_t}{(1+r)^t} + \frac{P_n}{(1+r)^n}$$
Gordon Growth Model of the Dividend Discount Model
Then here comes the question — what if you don't know when you want to sell? Or if you decided that you want to hold it for a very long term? This is when the famous Gordon growth model comes into play.
The Gordon growth model, developed by Myron J. Gordon and Eli Shapiro in 1956, is one of the most widely recognized equations in the field of security analysis. It assumes that dividends grow indefinitely at a constant rate, g.
$$D_t = D_0(1 + g)^t$$
By substituting the expression above to the n-period DDM, we can get:
$$V_0 = \frac{D_0(1 + g)}{(1 + r)} + \frac{D_0(1 + g)^2}{(1 + r)^2} + \cdots + \frac{D_0(1 + g)^n}{(1 + r)^n} + \cdots$$
As the equation above is a geometric series, that is, each term in the expression is equal to the previous term times a constant, which in this case is \(\frac{(1 + g)}{(1 + r)}\). Hence, this equation can be simplified into the following expression.
$$V_0 = \frac{D_0(1 + g)}{r - g} = \frac{D_1}{r - g}$$
The Dividend Discount Model (DDM) calculation
The Gordon Growth Model is the most fundamental DDM to value a stock. And today, we will focus on applying this method to value AT&T's stock.
The Gordon growth model allows us to derive the intrinsic value of a stock with just three inputs:
- The current annual dividend, \(D_0\)
- The cost of equity, \(r\), and
- The long-term dividend growth rate, \(g\).
How to obtain the inputs?
Now, let's discuss how we can get these inputs in real life.
-
To get the current annual dividend is simple — there are multiple public sources that allow you to get the data for free. I will list two here:
- The company's annual report. I highly recommend you to get the data from the annual report as it is recommended that you read the company's annual report before you even consider investing in it.
- Online databases for dividends, such as dividend.com. I only recommend using these databases if you already know the inside-out of the company in question and are merely looking for quick access to dividend data.
-
The cost of equity can be derived using the Capital Asset Pricing Model (CAPM). To understand CAPM and how to calculate the cost of equity, please read this.
-
Now we are left with the long-term dividend growth rate. As the model is based on indefinitely extending future dividends, the model’s growth rate should reflect long-term expectations.
There are two ways that you can achieve this:
-
Take the 10-year (or more) average dividend growth rate as a proxy. I recommend that you only use this method if the dividend growth rate has been relatively consistent for some time.
-
Take the sustainable growth rate as the long-term dividend growth rate.
The sustainable growth rate is defined as the growth rate of the dividends or earnings that can be sustained for a given level of return on equity, assuming that the capital structure is constant through time and that additional common stock is not issued.
As shown below, the sustainable growth rate is the combination of 2 components, namely the retention rate and the return on equity (ROE). Though it may seem complex, the concept is pretty intuitive. Retention rate is the proportion of retained earnings to further develop the business instead of being distributed as dividends. The ROE can be understood as the return on your equity investment. Hence, it makes sense that the sustainable growth rate of the company is the return on the reinvestment of the company's earnings.
$$g = b \times ROE$$
-
Dividend Discount Model Examples
Finally, it is time to answer the very question that has been asked at the beginning of this article — is the price of $29.13 too high or too low for AT&T (T)?
We will attempt to answer this question using the Gordon growth model explained above.
As mentioned above, we need three inputs to calculate the fair value of a stock using the Dividend Discount Model formula. Let's address it one by one:
-
Current dividend
At the time of writing, AT&T pays an annual dividend of $2.08.
-
Cost of equity
To calculate the cost of equity, we need the beta of the company, the risk-free rate, and the expected market return. As at the time of writing:
- Based on the data from the Financial Times, AT&T has a beta of 0.7319, which means it is less risky than the market portfolio.
- Taking the US 10-year bond yield as the proxy, the risk-free rate is assumed to be 1.07%.
- Based on the 10-year return of the S&P 500 index (from 2010 to 2020), the market return approximates 13.6%.
Using the CAPM:
$$ER_i = R_f + B_i(ER_m - R_f) = 1.07\% + 0.7319(13.6\% - 1.07\%) = 10.24\%$$
\(ER_i =\) Cost of equity
\(B_i =\) Beta of the stock
\(R_f =\) Risk-free rate
\(ER_m =\) Expected market return
-
Long-term dividend growth rate
The 10-year average dividend growth rate for AT&T is 2.16%.
Based on AT&T's 2019 annual report, it has a retention rate of 49% and a ROE of 7.57%. Hence, Sustainable growth rate = Retention rate x ROE = 49% x 7.57% = 3.71%
As AT&T's annual dividend growth rate has not exceeded 2.5% for more than 10 years, it is only reasonable that we use 2.16% as the long-term dividend growth rate.
Substituting these 3 inputs into the Gordon growth model, and we can get the fair value of the company's stock:
$$V_0 = \frac{D_0(1 + g)}{r - g} = \frac{\$2.08 \times (1 + 0.0216)}{0.1024 - 0.0216} = \$26.29$$
At the time of writing, the price of AT&T (T) is $29.13. According to the Gordon growth model, AT&T is overvalued by $2.84, or 9.75%, and qualifies for a sell so as long its price is above $26.29.
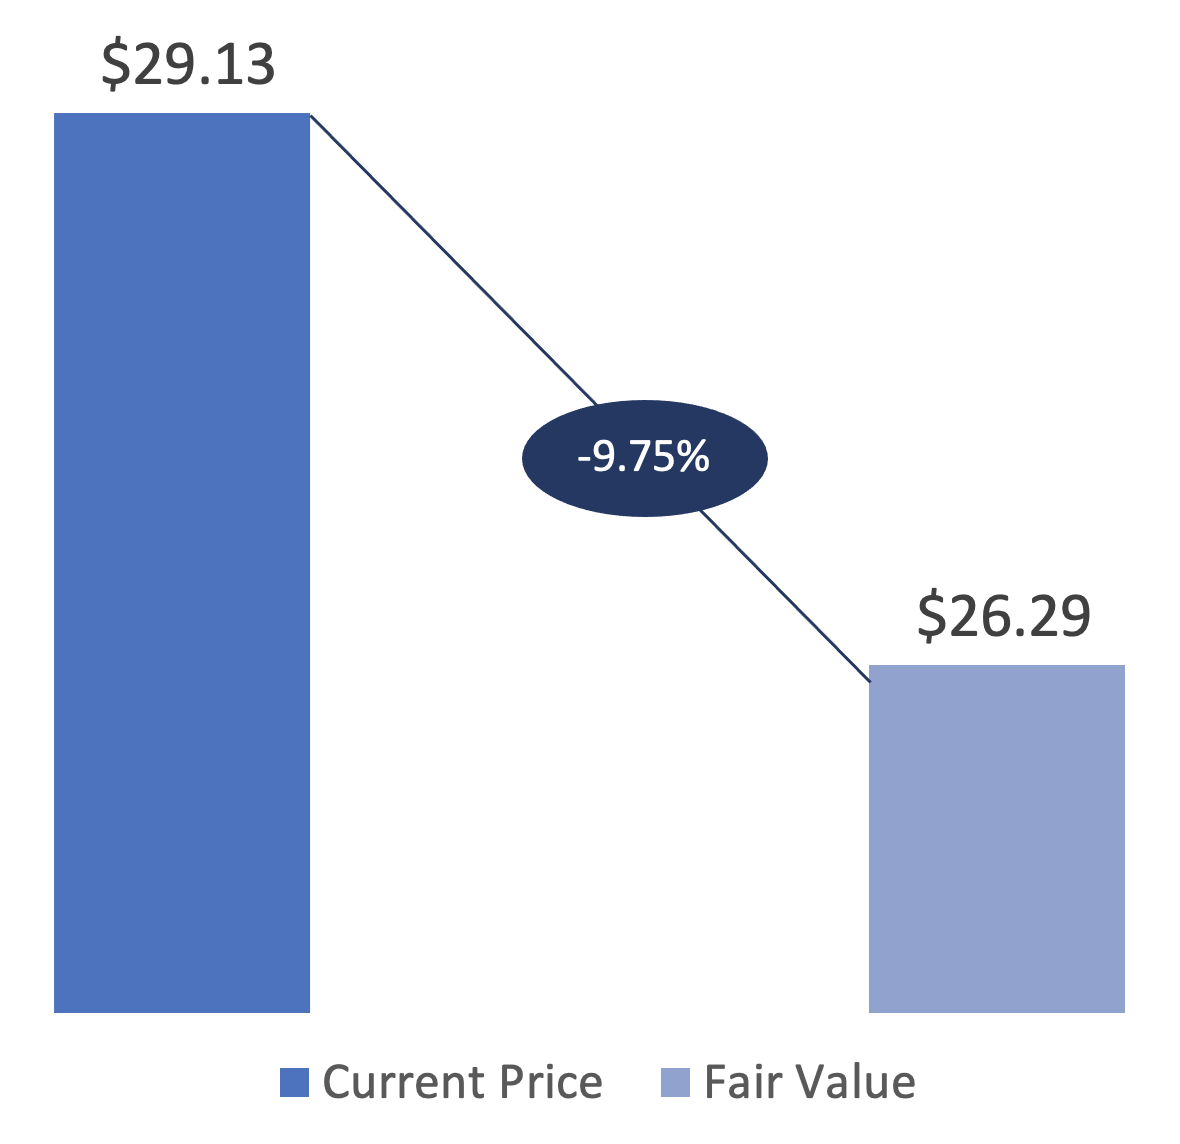
Figure 1: The results of the Dividend Discount Model (DDM) valuation, source: Alpha Investing Group
The Dividend Discount Model Calculator
Is this calculation too complicated for you? Worry not. We have you covered. With our Dividend Discount Model (DDM) Calculator, you can get the intrinsic value by applying this method in no time.
Strengths and Weakness of DDM
To correctly apply the Dividend Discount Model in real-life analysis, it is crucial to understand its strengths and limitations.
The following are the strengths of the DDM model:
-
The model is grounded in theory and easy to understand
The logic for the DDM is super simple. The logic for the DDM is super simple. When you buy a share of the business, besides owning part of the business, you are essentially paying to receive all the dividends that the corporation will pay throughout its lifetime. Hence, the value of the firm should be the value of the stream of dividends that you will be receiving in the future.
-
Dividends tend to be more reliable and stay consistent over long periods of time
Unlike cash flows and earnings, dividends tend to grow consistently, particularly for mature blue-chips companies.
-
Dividends are almost immune to financial reporting manipulations
Most of the time, adjustments need to be made for earnings and cash flows before they are inputted into a model as they are subjected to financial reporting manipulations. However, dividends tend to be very straightforward and require little adjustments.
-
Easy to calculate
It is evident that DDM is one of the simplest models out there. Unlike the Discounted Cash Flows (DCF) model, which needs a lot of projections and calculations, DDM only needs three inputs to be inputted into one DDM formula in order to arrive at the answer.
There are also some limitations:
-
The DDM is useless against companies with no dividends
Obviously, the DDM can’t be applied to companies that are not expected to pay dividends in the foreseeable future.
-
Dividend growth might be difficult to estimate for some companies
Some companies do not adhere to a stable dividend policy. This may threaten the accuracy of the results from DDM. Multistage DDM attempts to solve this issue.
-
The cost of equity and long-term dividend growth rate are very sensitive inputs
By increasing the long-term dividend growth rate used in the above example by a mere 1.0% (from 2.16% to 3.16%), the stock price will increase from $26.29 to $30.31. That is an increase of more than 15%. Changes in the cost of equity will have a similar effect.
So, it is recommended that we always perform sensitivity analysis to gauge how sensitive the results are to the cost of equity and the long-term dividend growth rate.
Below is an example of the sensitivity analysis performed for AT&T (T).
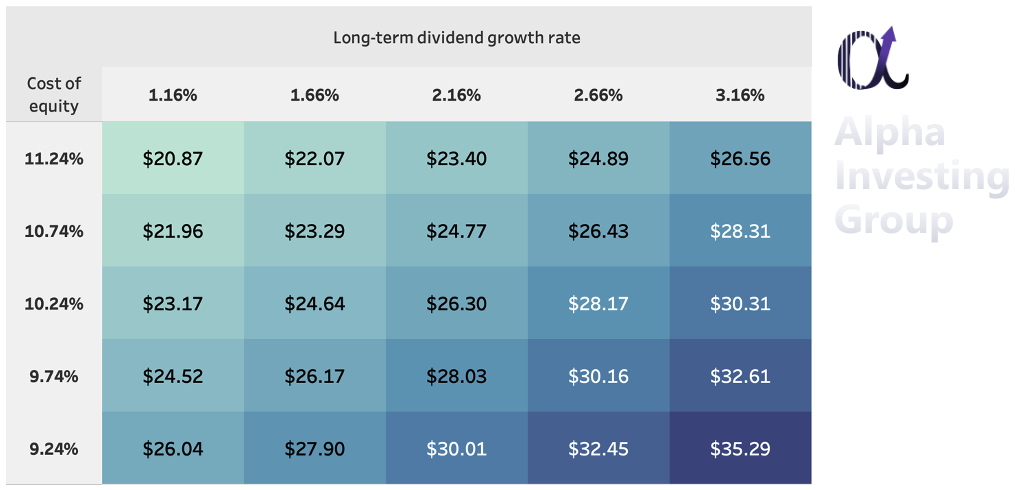
Figure 2: The sensitivity analysis for AT&T's (T) DDM Valuation, source: Alpha Investing Group
-
The DDM does not take into account id economic changes
A lot of the companies might cut or cancel their dividend should they perform poorly. The DDM often fails to account for this possibility.
Conclusion
All in all, the Dividend Discount Model is an easy yet solid way to evaluate blue-chip companies, especially if you're a relatively new investor. However, it won't tell you the whole story. So, if you're going to use the DDM model to evaluate stocks, do keep the limitations in mind.
Lastly, if you are interested in knowing more about DDM or other stock valuation topics, please leave your comments below. Also, please don't hesitate to give feedback. We are dedicated to producing the best content for you.